
Page 7 -
P. 7
เง นชวยเหลือและสวัสดิการ
7
38 ประเภท
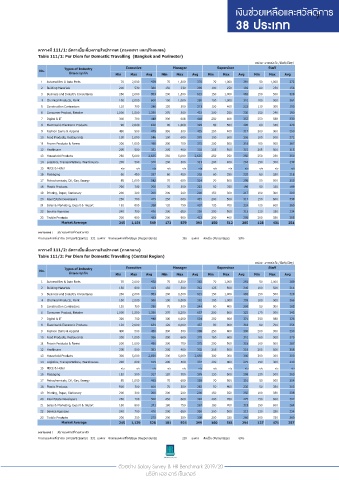
ตารางที 111/1: อัตราเบี ยเลี ยงภายในประเทศ (กรุงเทพฯ และปริมณฑล)
Table 111/1: Per Diem for Domestic Travelling (Bangkok and Perimeter)
หน่วย: บาทต่อวัน (Baht/Day)
Types of Industry Executive Manager Supervisor Staff
No.
ลักษณะธุรกิจ Min Max Avg Min Max Avg Min Max Avg Min Max Avg
1 Automobiles & Auto Parts 70 2,000 439 70 1,500 370 70 1,000 291 50 1,000 272
2 Building Materials 200 530 360 150 330 239 100 250 192 80 250 158
3 Business and Industry Consultancy 260 2,000 953 200 1,500 615 150 1,000 465 150 500 328
4 Chemical Products, Paint 100 2,000 600 100 1,000 380 100 1,000 310 100 500 264
5 Construction Contractors 120 700 340 120 500 271 120 400 222 110 300 193
6 Consumer Product, Retailer 1,000 1,500 1,250 270 500 423 200 250 230 150 240 190
7 Digital & IT 300 700 448 300 608 418 250 608 357 250 588 330
8 Electrical & Electronic Products 90 2,000 628 90 1,000 399 60 500 285 60 350 220
9 Fashion Items & Apparel 450 500 475 350 500 425 250 400 317 200 300 250
10 Food Products, Restaurants 100 1,000 546 100 600 370 100 600 306 100 500 271
11 Frozen Products & Farms 200 1,000 490 200 700 375 200 500 318 100 500 267
12 Healthcare 205 500 352 205 400 302 205 500 315 205 500 315
13 Household Products 250 5,000 2,625 250 5,000 2,625 250 250 250 250 250 250
14 Logistics, Transportations, Warehouses 200 500 370 200 500 321 200 400 263 150 300 239
15 MICE & Hotel n/a n/a n/a n/a n/a n/a n/a n/a n/a n/a n/a n/a
16 Packaging 60 450 287 60 450 302 60 350 232 60 350 218
17 Petrochemicals, Oil, Gas, Energy 85 1,000 542 70 650 314 70 500 295 50 500 255
18 Plastic Products 700 700 700 70 500 222 50 350 196 50 350 189
19 Printing, Paper, Stationery 200 200 200 200 200 200 150 300 217 100 300 200
20 Real Estate Developers 250 700 475 250 600 425 200 500 317 150 600 338
21 Sales & Marketing, Export & Import 120 800 398 120 750 407 120 700 324 120 600 260
22 Service Agencies 240 700 470 200 650 350 200 500 312 120 350 234
23 Textile Products 200 900 483 200 900 413 200 400 293 200 350 283
Market Average 245 1,154 549 172 879 393 150 512 285 128 431 251
หมายเหตุ : มีบางองค์กรที จ่ายตามจริง
จํานวนองค์กรที เข ้าร่วม (All participants) 331 องค์กร จํานวนองค์กรที ให ้ข ้อมูล (Respondents) 196 องค์กร คิดเป็น (Percentage) 59%
ตารางที 111/2: อัตราเบี ยเลี ยงภายในประเทศ (ภาคกลาง)
Table 111/2: Per Diem for Domestic Travelling (Central Region)
หน่วย: บาทต่อวัน (Baht/Day)
No. Types of Industry Executive Manager Supervisor Staff
ลักษณะธุรกิจ Min Max Avg Min Max Avg Min Max Avg Min Max Avg
1 Automobiles & Auto Parts 70 2,000 438 70 1,500 382 70 1,000 292 50 1,000 269
2 Building Materials 150 600 413 150 500 312 125 500 249 100 500 214
3 Business and Industry Consultancy 260 2,000 953 200 1,500 615 150 1,000 465 150 500 328
4 Chemical Products, Paint 100 2,000 588 100 1,000 382 100 1,000 309 100 500 266
5 Construction Contractors 120 700 290 70 500 244 60 400 206 50 300 183
6 Consumer Product, Retailer 1,000 1,500 1,250 270 1,200 657 200 500 322 170 300 242
7 Digital & IT 300 700 448 300 1,000 501 250 608 371 250 588 326
8 Electrical & Electronic Products 120 2,000 634 120 1,000 437 90 900 318 90 700 254
9 Fashion Items & Apparel 400 500 450 300 500 388 250 400 300 200 300 230
10 Food Products, Restaurants 200 1,000 556 200 600 370 160 600 310 160 500 275
11 Frozen Products & Farms 200 1,000 490 200 700 375 200 500 318 100 500 267
12 Healthcare 205 500 352 205 400 302 205 500 318 205 500 318
13 Household Products 300 5,000 2,650 300 5,000 2,650 300 300 300 300 300 300
14 Logistics, Transportations, Warehouses 200 600 415 200 500 337 200 400 274 150 300 240
15 MICE & Hotel n/a n/a n/a n/a n/a n/a n/a n/a n/a n/a n/a n/a
16 Packaging 120 500 317 120 700 376 120 500 298 120 500 265
17 Petrochemicals, Oil, Gas, Energy 85 1,000 495 70 650 328 70 500 310 50 500 254
18 Plastic Products 500 700 600 70 500 282 50 400 230 50 350 202
19 Printing, Paper, Stationery 200 200 200 200 200 200 150 350 250 100 350 238
20 Real Estate Developers 250 700 500 250 600 392 200 450 275 150 600 307
21 Sales & Marketing, Export & Import 180 800 371 180 750 367 180 700 319 150 600 264
22 Service Agencies 240 700 470 200 650 350 200 500 312 120 350 234
23 Textile Products 200 350 275 200 380 308 200 330 260 200 330 260
Market Average 245 1,139 528 181 924 399 160 561 294 137 471 257
หมายเหตุ : มีบางองค์กรที จ่ายตามจริง
จํานวนองค์กรที เข ้าร่วม (All participants) 331 องค์กร จํานวนองค์กรที ให ้ข ้อมูล (Respondents) 229 องค์กร คิดเป็น (Percentage) 69%
ตัวอยาง Salary Survey & HR Benchmark 2019/20
บริษัท เอช อาร เซ็นเตอร