
Page 7 -
P. 7
ื
เง นชวยเหลอและสวสดการ
ิ
ั
7
40 ประเภท
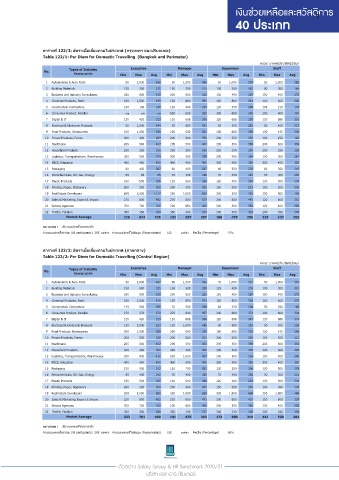
ตารางที 122/1: อัตราเบี ยเลี ยงภายในประเทศ (กรุงเทพฯ และปริมณฑล)
Table 122/1: Per Diem for Domestic Travelling (Bangkok and Perimeter)
หนวย: บาทต่อวัน (Baht/Day)
่
Types of Industry Executive Manager Supervisor Staff
No.
ลักษณะธุรกิจ Min Max Avg Min Max Avg Min Max Avg Min Max Avg
1 Automobiles & Auto Parts 50 2,000 456 50 1,500 380 50 1,000 307 50 1,000 285
2 Building Materials 150 350 225 150 300 215 100 300 182 80 300 164
3 Business and Industry Consultancy 260 600 430 200 500 320 150 450 287 150 400 270
4 Chemical Products, Paint 150 1,500 438 150 800 355 150 800 341 100 600 296
5 Construction Contractors 140 140 140 130 400 235 120 330 196 105 210 147
6 Consumer Product, Retailer n/a n/a n/a 500 600 550 300 600 450 200 600 367
7 Digital & IT 120 420 313 120 608 376 120 608 330 120 588 310
8 Electrical & Electronic Products 50 1,000 434 50 650 335 50 500 263 50 400 212
9 Food Products, Restaurants 100 1,000 536 100 600 351 100 600 290 100 425 256
10 Frozen Products, Farms 200 400 283 200 300 250 200 250 233 100 250 183
11 Healthcare 205 500 402 205 500 402 205 500 359 205 500 359
12 Household Products 250 250 250 250 250 250 250 250 250 250 250 250
13 Logistics, Transportations, Warehouses 200 500 374 200 500 339 200 400 284 150 300 267
14 MICE, Education 400 400 400 400 400 400 300 400 350 300 400 350
15 Packaging 60 450 287 60 450 287 60 350 203 60 350 215
16 Petrochemicals, Oil, Gas, Energy 85 85 85 70 350 240 70 350 223 50 300 200
17 Plastic Products 150 500 325 120 500 268 120 400 234 120 300 204
18 Printing, Paper, Stationery 200 200 200 200 200 200 150 300 217 100 300 200
19 Real Estate Developers 650 2,000 1,117 250 1,000 600 250 500 425 250 600 400
20 Sales & Marketing, Export & Import 270 800 592 270 800 537 200 800 442 120 800 351
21 Service Agencies 700 700 700 200 650 400 200 500 350 120 400 255
22 Textile, Fashion 350 350 350 350 400 370 300 350 316 200 350 276
Market Average 226 674 435 192 557 357 166 479 296 135 437 265
หมายเหตุ : มีบางองค์กรทีจ่ายตามจริง
็
ํ
ํ
จานวนองค์กรทีเข ้าร่วม (All participants) 285 องค์กร จานวนองค์กรทีให ้ข ้อมูล (Respondents) 162 องค์กร คิดเปน (Percentage) 57%
ตารางที 122/2: อัตราเบี ยเลี ยงภายในประเทศ (ภาคกลาง)
Table 122/2: Per Diem for Domestic Travelling (Central Region)
หนวย: บาทต่อวัน (Baht/Day)
่
Types of Industry Executive Manager Supervisor Staff
No.
ลักษณะธุรกิจ Min Max Avg Min Max Avg Min Max Avg Min Max Avg
1 Automobiles & Auto Parts 90 2,000 467 90 1,500 392 70 1,000 315 50 1,000 291
2 Building Materials 150 600 325 150 500 289 125 400 239 100 300 210
3 Business and Industry Consultancy 260 600 430 200 500 320 150 450 287 150 400 270
4 Chemical Products, Paint 150 1,500 478 150 800 373 150 800 318 100 600 275
5 Construction Contractors 140 600 295 70 500 258 60 330 206 50 250 168
6 Consumer Product, Retailer 270 270 270 270 600 457 240 600 372 200 600 328
7 Digital & IT 120 420 313 120 608 396 120 608 347 120 588 314
8 Electrical & Electronic Products 120 2,000 633 120 1,000 445 90 900 324 50 700 258
9 Food Products, Restaurants 200 1,000 588 200 600 370 160 600 302 120 425 269
10 Frozen Products, Farms 200 500 338 200 500 312 200 300 250 100 300 212
11 Healthcare 205 500 402 205 500 402 205 500 359 205 500 359
12 Household Products 300 300 300 300 300 300 300 300 300 300 300 300
13 Logistics, Transportations, Warehouses 200 600 412 200 1,000 407 200 500 316 150 500 295
14 MICE, Education 400 400 400 400 400 400 300 400 350 300 400 350
15 Packaging 120 500 317 120 700 381 120 500 306 120 500 278
16 Petrochemicals, Oil, Gas, Energy 85 400 242 70 400 280 70 400 268 50 300 212
17 Plastic Products 150 500 325 120 500 268 120 400 234 120 300 204
18 Printing, Paper, Stationery 200 200 200 200 200 200 150 350 250 100 350 238
19 Real Estate Developers 500 2,000 900 250 1,800 650 250 1,800 690 250 1,800 486
20 Sales & Marketing, Export & Import 220 800 482 220 900 472 200 800 427 150 800 339
21 Service Agencies 700 700 700 200 650 400 200 500 350 120 400 255
22 Textile, Fashion 350 350 350 350 400 377 300 330 308 200 330 258
Market Average 233 761 490 191 675 393 172 580 319 141 529 284
หมายเหตุ : มีบางองค์กรทีจ่ายตามจริง
จานวนองค์กรทีเข ้าร่วม (All participants) 285 องค์กร จานวนองค์กรทีให ้ข ้อมูล (Respondents) 195 องค์กร คิดเปน (Percentage) 68%
ํ
ํ
็
ตัวอยาง Salary Survey & HR Benchmark 2020/21
บริษัท เอช อาร เซ็นเตอร