Page 3 -
P. 3

Œ
                                                                                                        ิ
                                                                                     คาจางตามวุฒการศกษา
                                                                                       ‹
                                                                                       ‹
                                                                                                               ึ
                                                                                                                3
                                                                                     มากกว‹า 80 วุฒิ


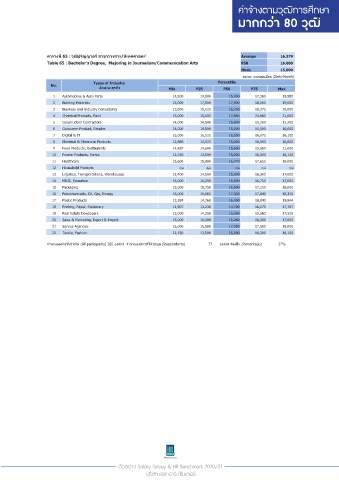
                  ตารางที 65 : วุฒิปริญญาตรี สาขาวารสาร/นิเทศศาสตร์                   Average              16,379

                  Table 65 : Bachelor's Degree,  Majoring in Journalism/Communication Arts  P50             16,000
                                                                                      Mode                 15,000
                                                                                        ่
                                                                                      หนวย: บาทต่อเดือน (Baht/Month)
                                  Types of Industry                           Percentile
                   No.
                                    ลักษณะธุรกิจ            Min       P25      P50       P75       Max
                    1  Automobiles & Auto Parts                       14,500               14,800  15,000              17,380               19,980
                    2  Building Materials                             15,000               17,500  17,900              18,000               19,000
                    3  Business and Industry Consultancy               13,500               15,125  16,750              18,375               20,000
                    4  Chemical Products, Paint                       15,000               15,655  17,540              25,665               31,000
                    5  Construction Contractors                       14,000               14,500  15,000              15,200               15,500
                    6  Consumer Product, Retailer                     14,000               14,500  15,000              15,500               16,000
                    7  Digital & IT                                   16,000               16,025  16,050              16,075               16,100
                    8  Electrical & Electronic Products               12,880               14,923  15,000              16,500               18,600
                    9  Food Products, Restaurants                     14,487               14,600  15,000              15,500               21,000
                   10  Frozen Products, Farms                         12,150               13,500  15,000              16,500               18,150
                   11  Healthcare                                     15,600               15,900  16,770              17,655               18,000
                   12  Household Products                       n/a       n/a       n/a      n/a       n/a
                   13  Logistics, Transportations, Warehouses               12,400               14,500  15,000              16,500               17,000
                   14  MICE, Education                                16,000               16,250  16,500              16,750               17,000
                   15  Packaging                                      15,000               15,750  16,500              17,250               18,000
                   16  Petrochemicals, Oil, Gas, Energy               16,000               16,665  17,330              17,840               18,350
                   17  Plastic Products                               13,284               14,760  16,400              18,040               19,844
                   18  Printing, Paper, Stationery                    11,907               13,230  14,700              16,170               17,787
                   19  Real Estate Developers                         13,000               14,250  15,000              15,563               17,500
                   20  Sales & Marketing, Export & Import               15,000               16,000  16,280              16,500               17,000
                   21  Service Agencies                               16,000               16,500  17,000              17,500               18,000
                   22  Textile, Fashion                               12,150               13,500  15,000              16,500               18,150

                  จานวนองค์กรทีเข ้าร่วม (All participants) 285 องค์กร  จานวนองค์กรทีให ้ข ้อมูล (Respondents)  77  องค์กร คิดเปน (Percentage)  27%
                  ํ

                                              ํ
                                                                                     ็


                                           ตัวอย‹าง Salary Survey & HR Benchmark 2020/21
                                                    บริษัท เอช อาร เซ็นเตอร
   1   2   3   4   5   6   7   8